EVERYTHING IS RELATIVE
We all remember Albert Einstein’s theory of relativity, made famous by his E=mc2 equation. Interestingly, Einstein’s theory of relativity had two distinct parts: 1) the theory of special relativity, which held that the laws of physics impacted all things equally regardless of perspective, and 2) the broader theory of general relativity which indicated that those perspectives could be altered by external forces, namely gravity.
As we are all still assimilating and processing the implications of GameStop’s meteoric rise and subsequent decline in price last week, there are some very interesting parallels to be drawn between Einstein’s theories and the stock market. Specifically how do we view present day stock market valuations; are they expensive, cheap, or somewhere in between?
Based solely on its own fluctuating stock price, GameStop first seemed expensive (which precipitated the short selling by hedge funds), cheap (when the short squeeze was first initiated), expensive (as investors piled into the stock), and then cheap again when it collapsed just days later. Who was right? It’s all relative…
There are some very interesting parallels to be drawn between Einstein’s theories and the stock market. Specifically how do we view present day stock market valuations; are they expensive, cheap, or somewhere in between?
Applying Einstein’s theory of relativity, we find that when looking at stocks, many investors tend to focus on absolute valuation (the stock is expensive because its valuations are materially higher versus where it was priced at an earlier date). In so doing, those same investors lose sight of Einstein’s contribution, which is to look at the stock market’s valuation relative to other external forces and inputs; most notably the bond market.
In this edition of “Cutting Through the Noise”, we will examine and apply a few common stock market valuation metrics to see what they can tell us about investment opportunities right now, as well as supplying some common sense context to those tools.
Has that Bungee Cord Bounced Back Up Yet?
In order to properly frame the stock market’s valuation, we need to understand where the economy is at present, as it has obviously experienced a great deal of volatility over the past year. So, let’s take a look, from an economic and earnings standpoint, at from where we came to where we are heading in the near future.
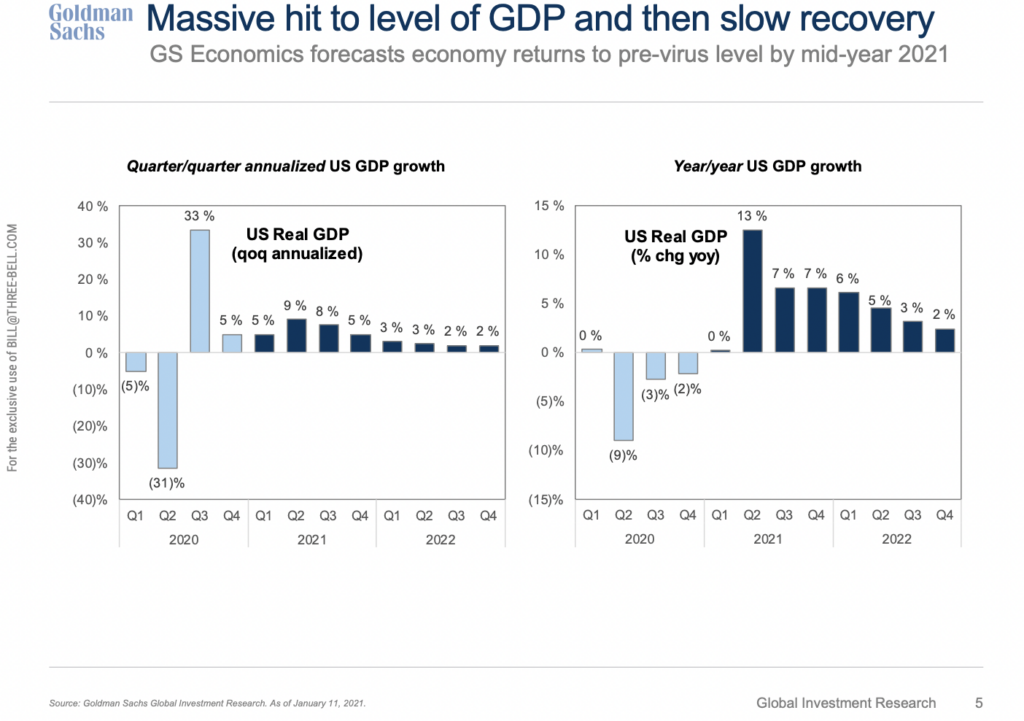
As you can see in the chart below, GDP dropped almost 40% annualized in Q1/2 of 2020 from the end of 2019. However, fiscal stimulus has gotten us back to above 90% of that beginning level, and consensus is that it appears we will set a new GDP high water mark for output in Q2 2021.
We thus now find ourselves entering the beginning of the economic expansion phase, post-recession. GDP is clearly coming back, and we believe will continue to do so as pent up consumer spending resulting from Covid-induced agoraphobia let’s loose.
Like a stretched rubber band, when consumers can once again consume as they normally would, we believe they will do so in spades, and that band is going to launch with velocity when when released. Couple this with unprecedented cash levels held by S&P 500 companies, cheap leverage, share buy backs, a waning trade war with China, and stimulus and spending bills, and you’ve got all the makings for the Roaring Twenties 2.0.
Like a stretched rubber band, when consumers can once again consume as they normally would, we believe they will do so in spades, and that band is going to launch with velocity when when released.
OK, the Economy is Recovering, but do Corporate Earnings Justify the Stock Market’s Valuation, or are we About to Experience Some Serious Gravity?
The chart below indicates earnings are in lock step with the overall economy and the government stimulus that helped the broader economy bounce back had an equal impact on corporate earnings. In fact, it appears that going forward, corporate earnings will continue to recover even more than the broader economy, due to operating leverage in corporate financials.
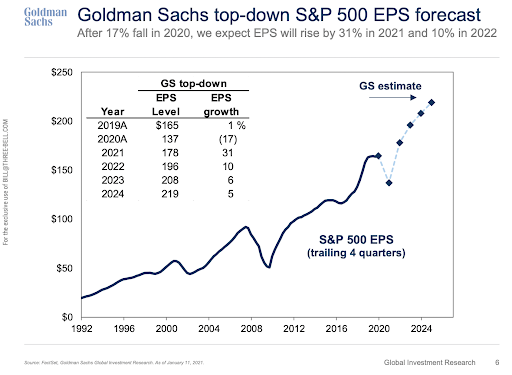
So, all in all, we have both a rebound in the US economy and a rebound in the value of the stock market overall, both of which are tracking to a swift recovery (aided of course by twin fiscal and monetary policy bazookas).
But the question still nags many investors: if the stock market was expensive going into Covid, and is now trading at valuations even higher than the pre-Covid period, aren’t we ripe for another fall? Did we really experience the type of supernova economic collapse that accompanies a recession, such that we are ripe to enter a true expansionary phase?
Good question, and the answer might surprise you. This is where Einstein’s relativity becomes particularly applicable. Let’s take a look at stock market valuation and opportunity in a relative framework.
Theory of Investment Relativity
When looking for superior risk adjusted expected return opportunities, we view valuation through a number of different lenses, utilizing a number of absolute and relative value factors, all of which can be studied through numerous market cycles. We can then gather this data for several asset classes, not just stocks and bonds, to build out our optimal portfolio.
From there, it is important to consider other factors beyond static charts and tables to provide important context (or true relativity) to our investment thesis. This key step can help us decide if these objective numbers and ratios make sense and how to best implement/weight our models.
It is important to consider other factors beyond static charts and tables to provide important context (or true relativity) to our investment thesis. This key step can help us decide if these objective numbers and ratios make sense
The more subjective factors include, but are not limited to, important elements such as: inflation expectations, tax policy, trade policy, fiscal stimulus, job growth, wages, profits and the productivity outlook for the labor markets. Oftentimes these more subjective considerations require an artistic eye to successful investing.
We don’t need to get these subjective elements exactly correct in the scientific sense every time. Rather use them to shape our insights to be more right than wrong and always understand the relationships prior to making investment judgements.
Quite simply, we need to have a repeatable investment framework that combines hard historical data, reflects our broader economic system, while understanding interdependent relative relationships of both.
The Gravity of the Situation: Absolute or Absolutely NOT….
Interestingly, and seemingly paradoxically, some stock market tools are highlighting how expensive the market appears to be on an absolute basis, while missing the opportunities that become more clear when evaluating the relative picture.
In the chart below, we compare a few absolute vs relative indicators:
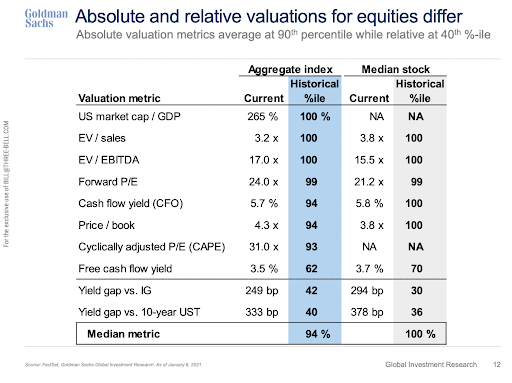
The table above shows several key stock market metrics. The top part of the panel shows valuation levels for the S&P 500 in an absolute sense. For example, the Forward P/E for the S&P 500 is currently hovering around 24. This level has only been exceeded 1% of the time in history (Historical %ile = 99). That would seem quite high in an absolute sense.
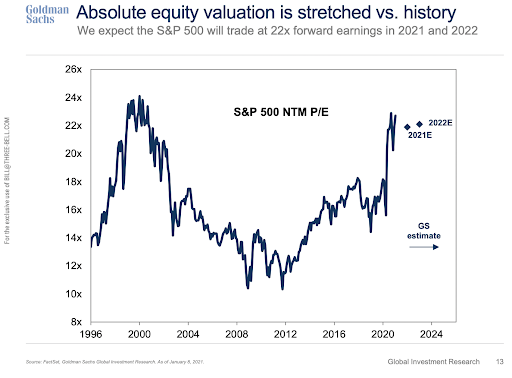
The chart above helps illustrate this dynamic. The stock market is priced to assume forward earnings that exceed 22x, which has only happened one other time in history; in 2000 right before the DotCom bubble burst and we entered a tech-led recession. Many investors look at this chart and think, “we must be headed for another correction.”
However, when we look at the bottom portion of the panel in Table 3, we see that stocks are still rather inexpensive on a relative basis….that is, relative to bonds, as illustrated in the chart below.
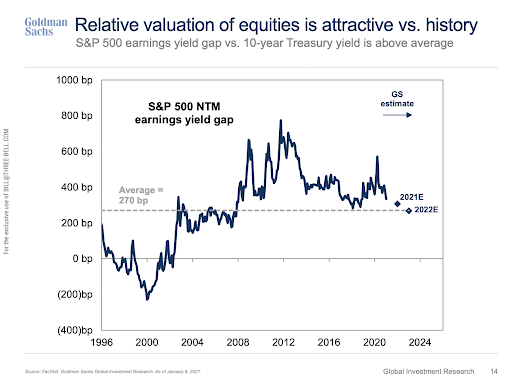
However, we prefer looking at the ‘double relative’ in the “Fed’s Stock Valuation Model” chart below, by Ed Yardeni. Ed and the Fed demonstrate that on a relative basis, in percentage terms and through time, stocks are near historically cheap levels. Just look at that…stocks appear ~80% undervalued based on the current level of the US Treasury 10 year note.
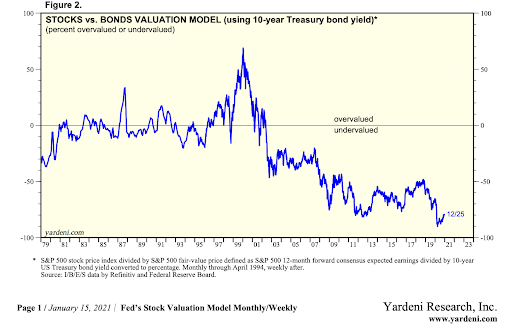
How and why is that the case? Why do bond market yields drive equity returns on a relative basis. We wrote about this in our June 2018 BEER Blog:
“During periods of economic expansion, which we are now entering post-recession, bond yields and stock market prices have generally traded inversely as they competed for investor capital. This is because when economic optimism grows, money moves into the stock market as investors seek to profit from economic growth and associated rising stock values.”
At its core, the BEER or Fed model evaluates whether investors are appropriately compensated for the price they are paying for riskier cash flows earned from stocks, by comparing them to the expected returns for bonds. Right now, bond yields are at historical lows, and The Fed is telling us they are likely to stay there through 2023, regardless of economic recovery. So, bonds are unattractive relative to stocks, increasing the likelihood capital continues to flow to the stock market, thus increasing valuations and attendant stock prices.
Conclusion
The correct interpretation of the above comparison between stock and bond yields, is not that stocks are cheap or expensive, but that stocks are cheap or expensive relative to bonds. We admit that stocks are historically expensive on a P/E basis, but we like them more than the 1-2% bonds can give us on a relative basis. In addition, we expect that as long as the economy continues to grow long-term and inflation doesn’t become too much of a problem, then soon our stocks will grow their dividends and either be priced at higher levels or their current price will be more secure.
We tend to like that trade off in the allocation decision between the three major asset classes of stocks, bonds, and cash. Next month we will find other alternatives that may look even better than stocks to fill out our investment universe and pursue our investment objectives.
Thus, one of our favorite Einstein quotes….
“Life is like riding a bicycle. To keep your balance you must keep moving.”
Albert Einstein
…has turned into one of my most followed investment axioms:
“Successful investing is like climbing a mountain. To make progress toward our goal, we must continually make the correct risk-adjusted steps, relative to all our options.”
Three Bell Capital


