Don’t Fear the Flats…

Is a Recession Looming Ahead? Risks and Opportunities of a Flat Yield Curve
- Is the treasury bond yield curve sending a dangerous signal about the economy?
- How have stocks historically performed in similar bond market environments?
- Can the Fed balance growth, inflation and maintain its independence?
- Should you refinance your mortgage in the present interest rate environment?
Two key issues currently facing the markets are tariffs, and the shape of the treasury bond interest rate curve. We tackled tariffs and trade last month and dig into the yield curve messaging this month.
The “yield curve” refers to the difference between the rate of the 10 year treasury minus the 2 year treasury rate. The yield curve is an important economic indicator. Why? Because, historically speaking, when the curve inverts to slope downward, (the short-term treasury rate rises above the longer-term rate) a recession is on the horizon.
This important interest rate indicator bears watching because stocks appear to be fully priced. Also, the biggest risk that would lead to a decline in stock prices is IF interest rates rise unexpectedly, or we have a recession that hurts earnings growth. As such, now that the yield curve is nearing flat, a number of prognosticators are beating the doomsday recession drum.
I don’t know about you, but I am moderate skier (on the decline) and have most of my worst falls on the proverbial “last run of the day”…at the flat section at the bottom of the hill. As such, I have been conditioned to fear the congested flats.
At the risk of stretching this metaphor beyond its useful lesson; contrary to the mess that can occur at the bottom of the ski hill, the black diamond runs (inverted yield curve) remain most hazardous. That said, we are clearly entering the flats, and this month we take a good hard look at whether or not that should be cause for alarm.
Do We Need Ski Patrol?
There are many theories as to why the economy dips into a recession once the yield curve inverts. I will spare you most of the speculation surrounding these linkages. However, the most commonly accepted reason is because banks borrow (pay interest rates to their depositors) at the short interest rate and lend or make loans based on the long interest rate. Therefore, when the short rates are higher than the long rates, the incentive to make bank loans disappears. Fewer bank lending leads to a slower or shrinking economy. More on this later.
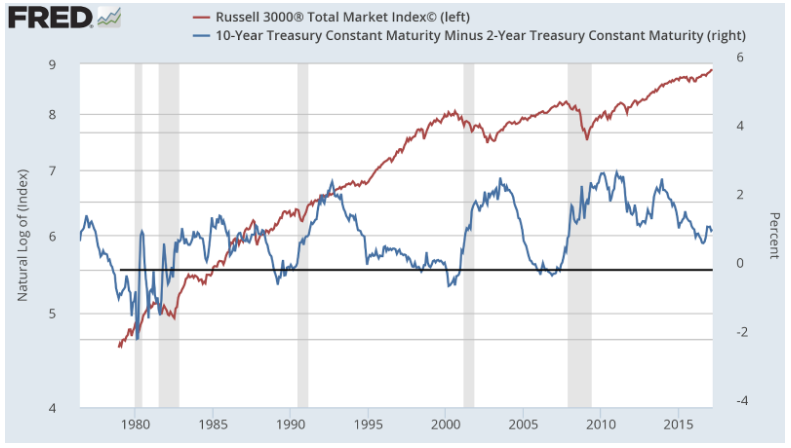
The chart above illustrates how (since 1980) the economy has always gone into a recession (grey vertical bars) within 18 months of the yield curve (blue line) turning negative. In fact, this relationship has held for the past 9 recessions dating back to the 1950’s. Note that flattening does NOT signal a recession – only inversion does.
The negative yield curve is represented by the blue line dipping below the solid, horizontal black line at the “zero” mark on the left hand scale. This was consistently the case in the 1980, 1990, 2001, and 2008 recessions.
The chart above also shows the health of the stock market (red line) relative to the shape of the yield curve. Notice that the stock market has done quite well with the exception of the periods surrounding recessions.
Since the curve is not yet even flat, there could still be plenty of meat on the equity-returns bone and plenty of time to de-risk.
This is why we believe that while the stock market is fairly/fully priced, it will likely do just fine as long as we do not enter a recession. Even though the chart is a bit dated, it accounts for all recessions in the past 40 years. In any event, the market has continued to run up ~35% since the end of 2016 as the yield curve has flattened from just over +1% to about +0.25% today.
Speaking of recessions, the Federal Reserve has a forward looking economic indicator that helps them keep an eye on the probability of a recession. The current reading of this model indicates the odds of a recession occurring in the next 12 months are below 5%.
NOTE: The market has only spent approximately 36 months in recession over the past 40 years. That equates to approximately 4 weeks per year.
These Runs Are Groomed
Let’s look at how the stock market has done when the yield curve has INVERTED.
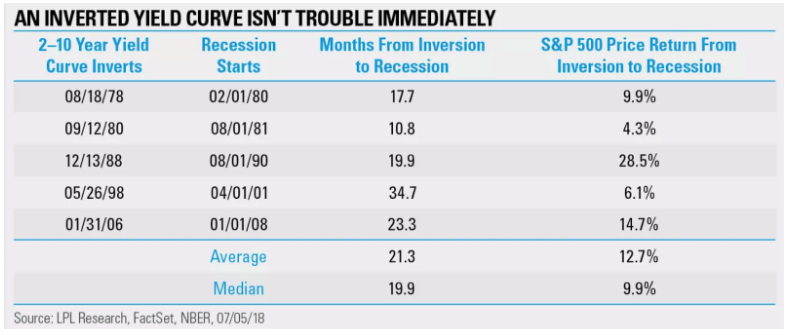
As the table above indicates, the market has done just fine, especially during the past three instances of the yield curve inverting, despite ultimately leading to a recession.
In fact, those last three observations actually delivered an average return of 32%, after the yield curve inverted. Since the curve is not yet even flat, there could still be plenty of meat on the equity-returns bone and plenty of time to de-risk.
I would never be caught uttering these infamous four words when talking about markets: “This time is different.” However, I will say, “perhaps this cycle may not be exactly the same.”
Below is an excerpt by By Dr. Sonu Varghese via Iris.xyz. The title of the article is “How Monetary Policy Works”…Aug 11, 2018.
“Typically, a flattening yield curve, and eventually an inverted one, has been driven by rapidly rising short-term interest rates, while long-term interest rates rose at a much slower pace, if at all. Yet, the mechanism that links yield curve inversions to recessions is not clear and so there is always a question of whether “this time is different” – including by Fed Chair Ben Bernanke after the yield curve inverted in 2006.
In this cycle, a lot of focus has fallen on the fact that global bond markets have been warped by unconventional monetary policy over the past several years. Bernanke, once again, suggests that the yield curve’s power to signal a recession may have diminished because normal market signals have been distorted by regulatory changes and quantitative easing in other jurisdictions.
On the other hand, as Minneapolis Fed President Neel Kashkari points out, “this time is different” may be the four most dangerous words in economics. He says that if the Fed continues to raise rates, not only are they risking yield curve inversion, but also contractionary monetary policy that will put the brakes on the economic recovery. Though the question remains as to how this may happen.”
I would never be caught uttering these infamous four words when talking about markets: “This time is different.” However, I will say, “perhaps this cycle may not be exactly the same.”
The reason most economic cycles come to an end is because increased economic activity heats up and causes inflation to rear its ugly head.
Although it is indisputable that the shape of the mountain remains the same, the snow conditions can vary greatly.
- At the very least, this time is more like the last three recessions (1988, 1998, 2006) than the first two (1978 and 1980). The first two were fighting high double digit inflation with short interest rates approaching 20%; steep and icy moguls. In fact, rates are now significantly lower than all other instances. That is a net positive for the stock market.
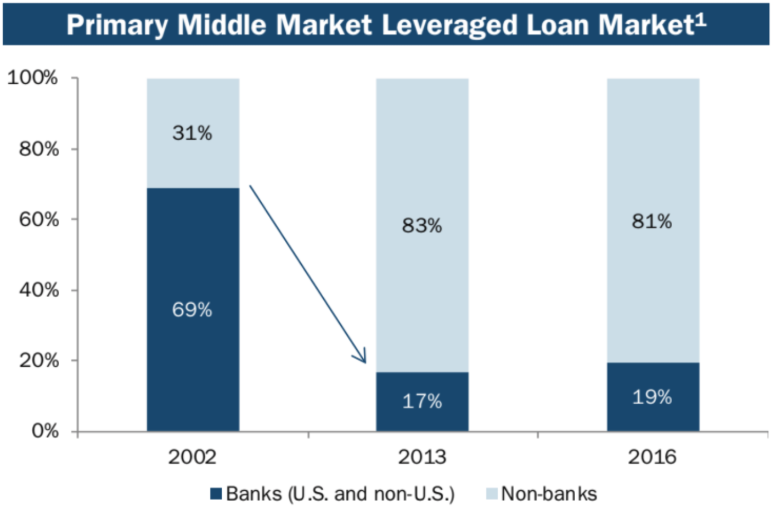
- There is much more private credit lending in the market today, particularly through hedge funds and private equity. Increased private credit lending offsets reduced bank lending, helping to stave off recession in a flat yield curve environment. For instance, in the table below, note how the supply of lending amounts in the Middle Market lending market has reversed from banks to private capital being offered from non-banks. This growth in lending could be the difference in helping to keep the rails of economic growth greased, which could prove to be the difference between recession and continued economic growth.
 Source: S&P LCO
- Banks have diversified their operations and are not as dependent on that yield curve as they were in the past. This is particularly due to the practice of securitizing and selling/hedging their loans.
- Most importantly, the FED has expanded its tool box since the Great Financial Crisis of 2008. We have seen them introduce Quantitative Easing (QE) and remove “mark to market” accounting for banks. Those new policies, which had not been used prior to 2008, help to favorably manipulate markets during periods of disruption. Just the threat of returning to QE activities could buoy investor sentiment.
Let’s Hope the Fed Can Ski, Snowboard and Land Their Aerials
Can the Fed keep inflation in check without damaging growth? That is their dual mandate. The reason most economic cycles come to an end is because increased economic activity heats up and causes inflation to rear its ugly head.
… for the first time in several decades, a Presidential administration is challenging the independence of the Fed by suggesting that it slow its interest rate hikes.
Rising fears of increasing inflation will often lead to a flattening yield curve. The yield curve typically flattens because the Fed becomes concerned about inflationary pressures, so they raise short term rates to tame inflation and subsequently slow the economy.
This is why it will be important to keep an eye on inflation this cycle and see what the market is expecting. Is the Fed ahead of the curve and keeping inflation expectations within an acceptable range (1.5-2.5%)…OR, do we see expectations growing toward deleterious levels?
5 Year, 5 Year Forward Inflation Expectation Rate
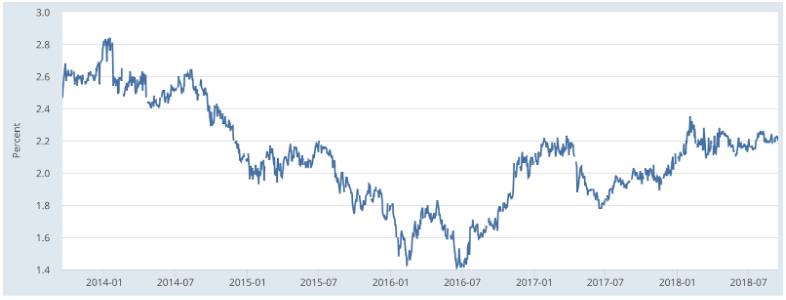
Source: Federal Reserve Bank of St. Louis
The chart above shows the market’s inflation expectations for the 5 years that follow the next 5 years…specifically, that means years 2023-2028. This is the inflation expectation chart that investment professionals follow most closely. At present, the Fed is doing a good job in managing their dual mandate of price stability and full employment.
That’s all well and good… except that for the first time in several decades, a Presidential administration is challenging the independence of the Fed by suggesting that it slow its interest rate hikes. This unusual interference could impact Fed policy and ultimately the perception of their independence, which could erode its credibility.
It will [sic] also be important that inflation remains subdued to keep this economic recovery and bull market going.
Credibility is the currency of a central bank. It is what keeps democracies from approaching banana republics, e.g. Argentina, where it is currently ski season. The attached chart shows how the Argentine peso has declined 90% in past 10 years. Once a central bank loses confidence, it is tough to get it back.
Think about it, if a central bank is not independent, but rather politically aligned/influenced, what would prevent an administration from goosing the economy every election cycle without fear of inflation? That lack of trust would lead investors to take less risk, make fewer investments, stick their money under the mattress, and ride the bunny slope.
Here’s the irony – the Fed may be forced to raise interest rates to cool the inflation caused by the double whammy of tariffs and tax cuts this late in the economic cycle. It is important for the Fed to respond independently to inflationary threats. It will also be important that inflation remains subdued to keep this economic recovery and bull market going.
Conundrum – So, if the Fed alters the expected path of interest rate increases, market participants may suspect the Fed is being unduly influenced by the administration, which will likely damage Fed credibility.
Storm clouds have a habit of gathering quickly, causing the slopes to get icey and dangerous. This is a time to stick to the blue slopes and not push too hard for more risk; yet it is no time to call it quits and take the gondola back down the hill.
Put on Your Snowshoes and Take a Look at Your Mortgage
The Federal Reserve can only really directly control a short term rate of interest called the Federal Funds Rate. However, the Federal Funds Rate often serves as a benchmark rate for other interest rates like LIBOR, off of which most adjustable rate loans such as ARM’s, credit cards, and bank loans, are priced. Those with ARM’s that have no plans to sell their home in the near future, may want to consider refinancing into a longer term fixed-rate loan. Here’s why:
While the yield curve can be an excellent predictor of future economic activity, we feel other key early warning indicators need to ignite before the economy finds itself in a recession.
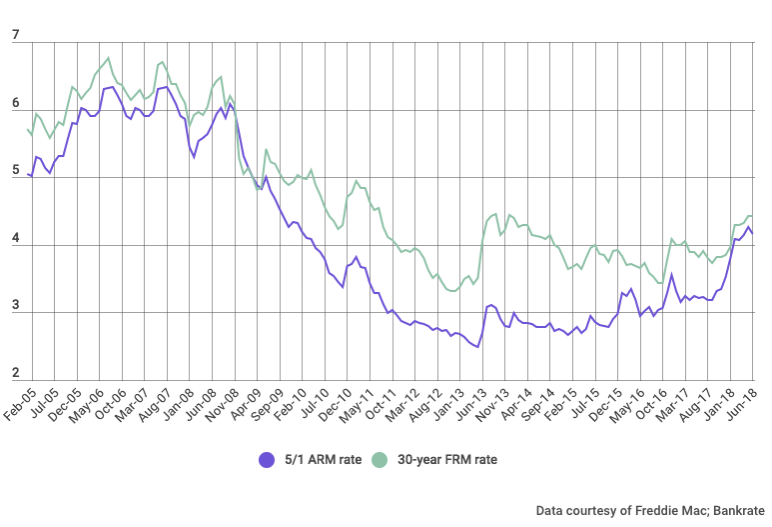
As these ARM’s hit their reset dates, at present the new rates won’t be much lower than those associated with long-term fixed-rate mortgages. If the yield curve actually inverts, those with an ARM could be paying more than those with a long term fixed rate mortgage. Moreover, should interest rates fall, which we think is highly unlikely in the near to medium term, those with fixed rate mortgages can always choose to refinance lower.
As can be seen in the chart below, a few years ago, when many people took out ARM’s instead of fixed rate mortgages, the spread between the two types of loans made ARM’s more attractive. However, this spread is has been dramatically reduced, and the long term advantage of a fixed rate loan now outweighs the short term benefits of a ARM, FOR THOSE WHO DO NOT INTEND TO SELL THEIR HOMES.
Apres Ski Round-Up
History is against the economy IF the yield curve inverts, which is why this topic along with trade (last edition) are the TWO most important issues currently facing the market.
The financial press has focused on the shape of the Treasury Yield Curve for most of this year. While the yield curve can be an excellent predictor of future economic activity, we feel other key early warning indicators need to ignite before the economy finds itself in a recession. Stay tuned for a discussion about these key early warning signals in future reports.
See you in the lodge.