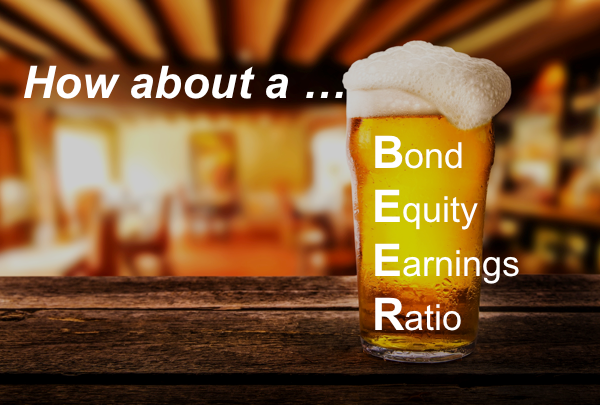
How About a BEER?
Let’s Tap A BEER To See If Stocks Are Over, Under, Or Fairly Valued
“Interest rates and volatility are on the rise, as are investor jitters, so now is the perfect time to pop open the BEER analysis.”
Lager, ale, IPA, steam, stout, or pilsner? Nope, that’s not what we’re here to discuss. This BEER is both non-alcoholic and gluten-free. I know what you’re thinking: “That beer sounds terrible! Why would I want that?” Because our BEER is going to help us more effectively navigate the stock market.
Our BEER, the Bond Equity Earnings-yield Ratio, is a simple, interest rate-based, stock market valuation tool, used by the Federal Reserve Bank to determine if stocks are cheap (stein is half full), or expensive (stein is half empty), relative to bonds.
Interest rates and volatility are on the rise, as are investor jitters, so now is the perfect time to pop open the BEER analysis. Interestingly, this edition of “Cutting Through the Noise” provides a glass “half full” example of the stock market’s valuation. Well, what else would you expect when discussing BEER? Read on!
The Bond Market as a Predictor of Stock Performance
“Are we in a period where money is likely to continue to flow into the stock market and drive stock prices higher? Or, are we in a period where bonds are attractive enough to prevent that flow of capital from occurring?”
Before we jump into the BEER analysis, recall that last May we evaluated the market through the lens of the CAPE (Cyclically Adjusted Price to Earnings) ratio, which showed the market to be approximately 30-50% expensive vs. historical prices – or glass “half empty”.
The CAPE analysis would seem to point to an overvalued stock market which we might conclude we should avoid. However, CAPE is only only one vantage point, and it is important to remain open to a variety of viewpoints when constructing an investment strategy. We’ll discuss this in greater depth later in this article, after we crack open our BEER.
So, why would you look to interest rates and the bond market in an attempt to predict returns in the stock market? Good question.
During periods of economic expansion, which has been the case for the last nine years since the Financial Crisis, bonds yields and stock market prices have generally traded inversely as they compete for investor capital. This is because when economic optimism grows, money moves into the stock market as investors seek to profit from economic growth and associated rising stock values.
Conversely, selling in the stock market generally leads to lower bond yields as money moves out of the stock market and into the bond market, as investors flee to safety. We presently find ourselves experiencing expanded economic growth, the stock market has done remarkably well for almost a decade, and interest rates are beginning to rise, even though they remain near historical lows.
The key question to ask and answer is thus: Are we in a period where money is likely to continue to flow into the stock market and drive stock prices higher? Or, are we in a period where bonds are attractive enough to prevent that flow of capital from occurring? This is precisely the question which the BEER analysis is designed to answer.
OK, Let’s Brew
The Bond Equity Earnings-yield Ratio (BEER) is a metric used to evaluate the relationship between bond yields and stock earnings yields. At its core, the BEER or Fed model evaluates whether investors are appropriately compensated for the price they are paying for riskier cash flows earned from stocks, by comparing them to the expected returns for bonds.
BEER has two parts – a benchmark bond yield (10-year Treasury), divided by the current earnings yield of a stock benchmark (such as the S&P 500).
BEER = Bond Yield / Stocks Earnings Yield (E/P)
The key insight from this equation is that the lower the interest rate – the higher the expected stock price. Taking that further, standard P/E ratios as a predictor of stock market performance do not account for the present interest rate regime. Adding the interest rate component to the BEER framework provides for a more robust stock market valuation analysis.
Is The Tap Foamy Or Flat?
“At present, the stock market appears undervalued by ~50% relative to interest rates, which leaves plenty of room for more froth (as long as interest rates remain low).”
So, what does BEER tell us about the current and potential future value of the the stock market?
Figure 1 below shows the relationship between the 10 year US Treasury bond and the earnings yield of the S&P 500 based on the next year’s forward earnings.
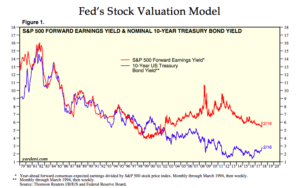
The Bond Yield in the numerator is the straight-forward yield of the 10yr US Treasury. The (E/P) in the denominator is simply the inversion of the P/E ratio for the S&P 500. Inverting the P/E ratio into an E/P yield is done to compare “apples to apples” or Bond Yield to Stock Earnings Yield.
Historically, we have seen the yield on stocks and bonds to be about the same, up until 1999-2000. Around that time, prices of stocks went up disproportionately to their underlying earnings and relative to bond yields. Stocks were expensive (red line below blue line) relative to bonds in early 2000, and under performed coming out of that period.
Since that time, stocks have been cheap relative to bonds (red line above blue line), largely due to the impact of Central Bank policies that have suppressed interest rates. It is important to note that stocks outperformed (as predicted by the BEER model) over this past 15 year period – including the market crash of of late 2007 to early 2009.
Figure 2 below illustrates the over/under valuation of the stock market relative to the bond market according to the BEER analysis within a single line by dividing the blue line by the red line in Figure 1 above. What we see is that, according to BEER, the stock market has not been overvalued since that big spike up around 2000.
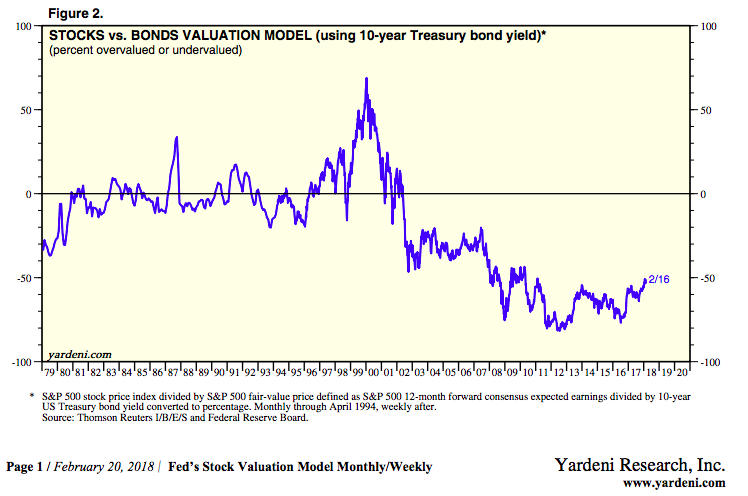
At present, the stock market appears undervalued by ~50% relative to interest rates, which leaves plenty of room for more froth (as long as interest rates remain low). Ten-year bond yields have historically equaled Nominal GDP, which would be ~5% today… and yet current yields are only 2.9%, which makes bonds quite expensive. Historical P/E’s have averaged 15% and are currently at 16.3%. Considering the present level of interest rates, one could make the case that stocks are actually cheap…as long as we don’t have a recession.
However, note that the Fed model above shows the stock market was actually viewed as inexpensive going into 2008, prior to selling off ~50%. It is important to understand that, while the market was cheap visavis bonds during that 2008 time period, it may have also been absolutely expensive. That 2008 period could be somewhat analogous to today’s market prices, but to a much smaller degree. Specifically, stocks are likely somewhat expensive in an absolute sense, but they remain cheap relative to the more expensive bond market.
So What Can We Expect From the Stock Market Going Forward… Light or Dark BEER?
Occasionally financial market pundits carelessly opine that, “Stocks are undervalued according to BEER or the Fed Model (or interest rates).” Although this might be a true statement, it is careless because it implies that stock prices will necessarily go higher.
The correct interpretation of the above comparison between stock and bond yields, is not that stocks are cheap or expensive, but that stocks are cheap or expensive relative to bonds. It may be that stocks are both cheap vs bonds and expensive in an absolute sense, which could make stocks priced to deliver returns below their long-term average.
However, it may also be true that bonds are even more expensive than stocks and priced to deliver returns far below their long-term average and could actually lose principal after factoring in inflation. Be aware that both stocks and bonds could lose money under the scenario highlighted above.
This should not come as a surprise, since both stocks and bonds have collectively offered record positive returns for the past 35 years, which could set up for a big bout of mean reversion at some point. Hmmmm…perhaps we need to further diversify beyond just stocks and bonds?
Importantly, the BEER model can help explain why stocks have done so well in the face of many pundit proclamations that the market is expensive. Additionally, this analysis demonstrates how equities could continue to climb higher, even while they remain expensive by other measures.
Mugs or Steins?
“…BEER (or some similar signal) is likely the measure used by Warren Buffet when he claims the stock market is cheap.”
It’s clear that the strength of the BEER framework is the incorporation of the additional bond yield component, which helps provide richer context to the stock market valuation analysis. Conversely, the weakness of BEER is that the inclusion of the bond yield creates a relative comparison, which can send a misleading signal if both stocks and bonds are cheap/expensive. Ultimately this relative analysis could lead to false signals at the wrong time.
This is in stark contrast to our CAPE analysis, whereby the strength of the CAPE ratio is its objectivity, by averaging valuation levels over an entire market cycle. The weakness of CAPE is that it does not consider other inputs, such as interest rates or growth rates, which can lead an investor to miss major upswings in the market.
Just as CAPE and standard P/E ratios have imperfections, so does the BEER analysis. These two vastly different approaches often arrive at two wildly different conclusions, while each methodology independently attempts to answer the same question.
I liken these different approaches to viewing the same picture through different lenses. Sometimes the Rx is just right and the viewer is able to sharply see the proper valuation, while other times the picture is fuzzy, making it difficult to discern over/under valuation.
As a point of reference, BEER (or some similar signal) is likely the measure used by Warren Buffet when he claims the stock market is cheap. Psssst… just don’t ask Warren why he holds $120B (or 20% of his market value) in cash within Berkshire Hathaway, if the market is so cheap…
Avoiding Confirmation Bias
So why do we spend so much time looking at competing analytical frameworks when determining our investment decisions, when they often arrive at radically different conclusions?
Incorporation and analysis of multiple conflicting viewpoints is critical to avoiding what behavioral finance refers to as “confirmation bias.” Confirmation bias occurs when an investor exclusively follows analysts or strategies with which they already agree. This can lead investors to take on too much risk at certain points of the cycle, or to miss major upswings, because they fail to adequately take into account alternative opinions and analysis.
How many of us watch both FOX News and MSNBC – I mean both of them equally?! Not many. When investing, it is equally important to be aware of what the “Pollyannas” are professing, as well as the rhetoric of the “Sky is Falling” types – and everything in between. Think of it as looking both ways when crossing the street.
It is always possible to find some really smart people on both sides of the market providing equally strong arguments toward being a buyer or a seller. It is up to the prudent investor to determine which argument is correct at any particular time.
Hence the need to seek multiple quantitative viewpoints like both CAPE and BEER and beyond.
How’s The Wine?
As we just noted, it is important to consider as many flavors or methodologies as possible. More information is always better when building your investment mosaic.
This should include making logical adjustments along the way to draw common sense conclusions regarding risk/return assessments for the markets. It is helpful to know that some relatively straight-forward metrics view the stock market as cheap, while other, equally-sensible measures, view the market as expensive.
BEER and CAPE are simple and straightforward measures, but there are still other more complex and refined models (we’ll call them wine – When Investors Need more Explanation), which can also be very helpful in determining the markets valuation.
In fact, these more detailed models imply that the stock market is neither cheap nor rich at present, but fairly valued. Let’s leave those more complex examples for another day.
Regardless of the valuation tool, it will be important for earnings to continue to grow faster than the increase in real interest rates for stocks to continue to deliver that refreshing taste of higher returns.
Cheers!